Calculation Server
Use existing tags already stored in the Canary Historian to create new calculated tags.
What Calculations Will You Create?
Each Canary System includes a Calculation Server you can use with existing Canary Historian tags to create new calculated tags that are then stored in the Canary Historian.
With the Calculation Server you can:
- Combine multiple tag values to create averages
- Roll-up daily totals into weekly accumulations.
- Create new tags based on the relationship of other tag values.
Ways to Use Calculated Tags
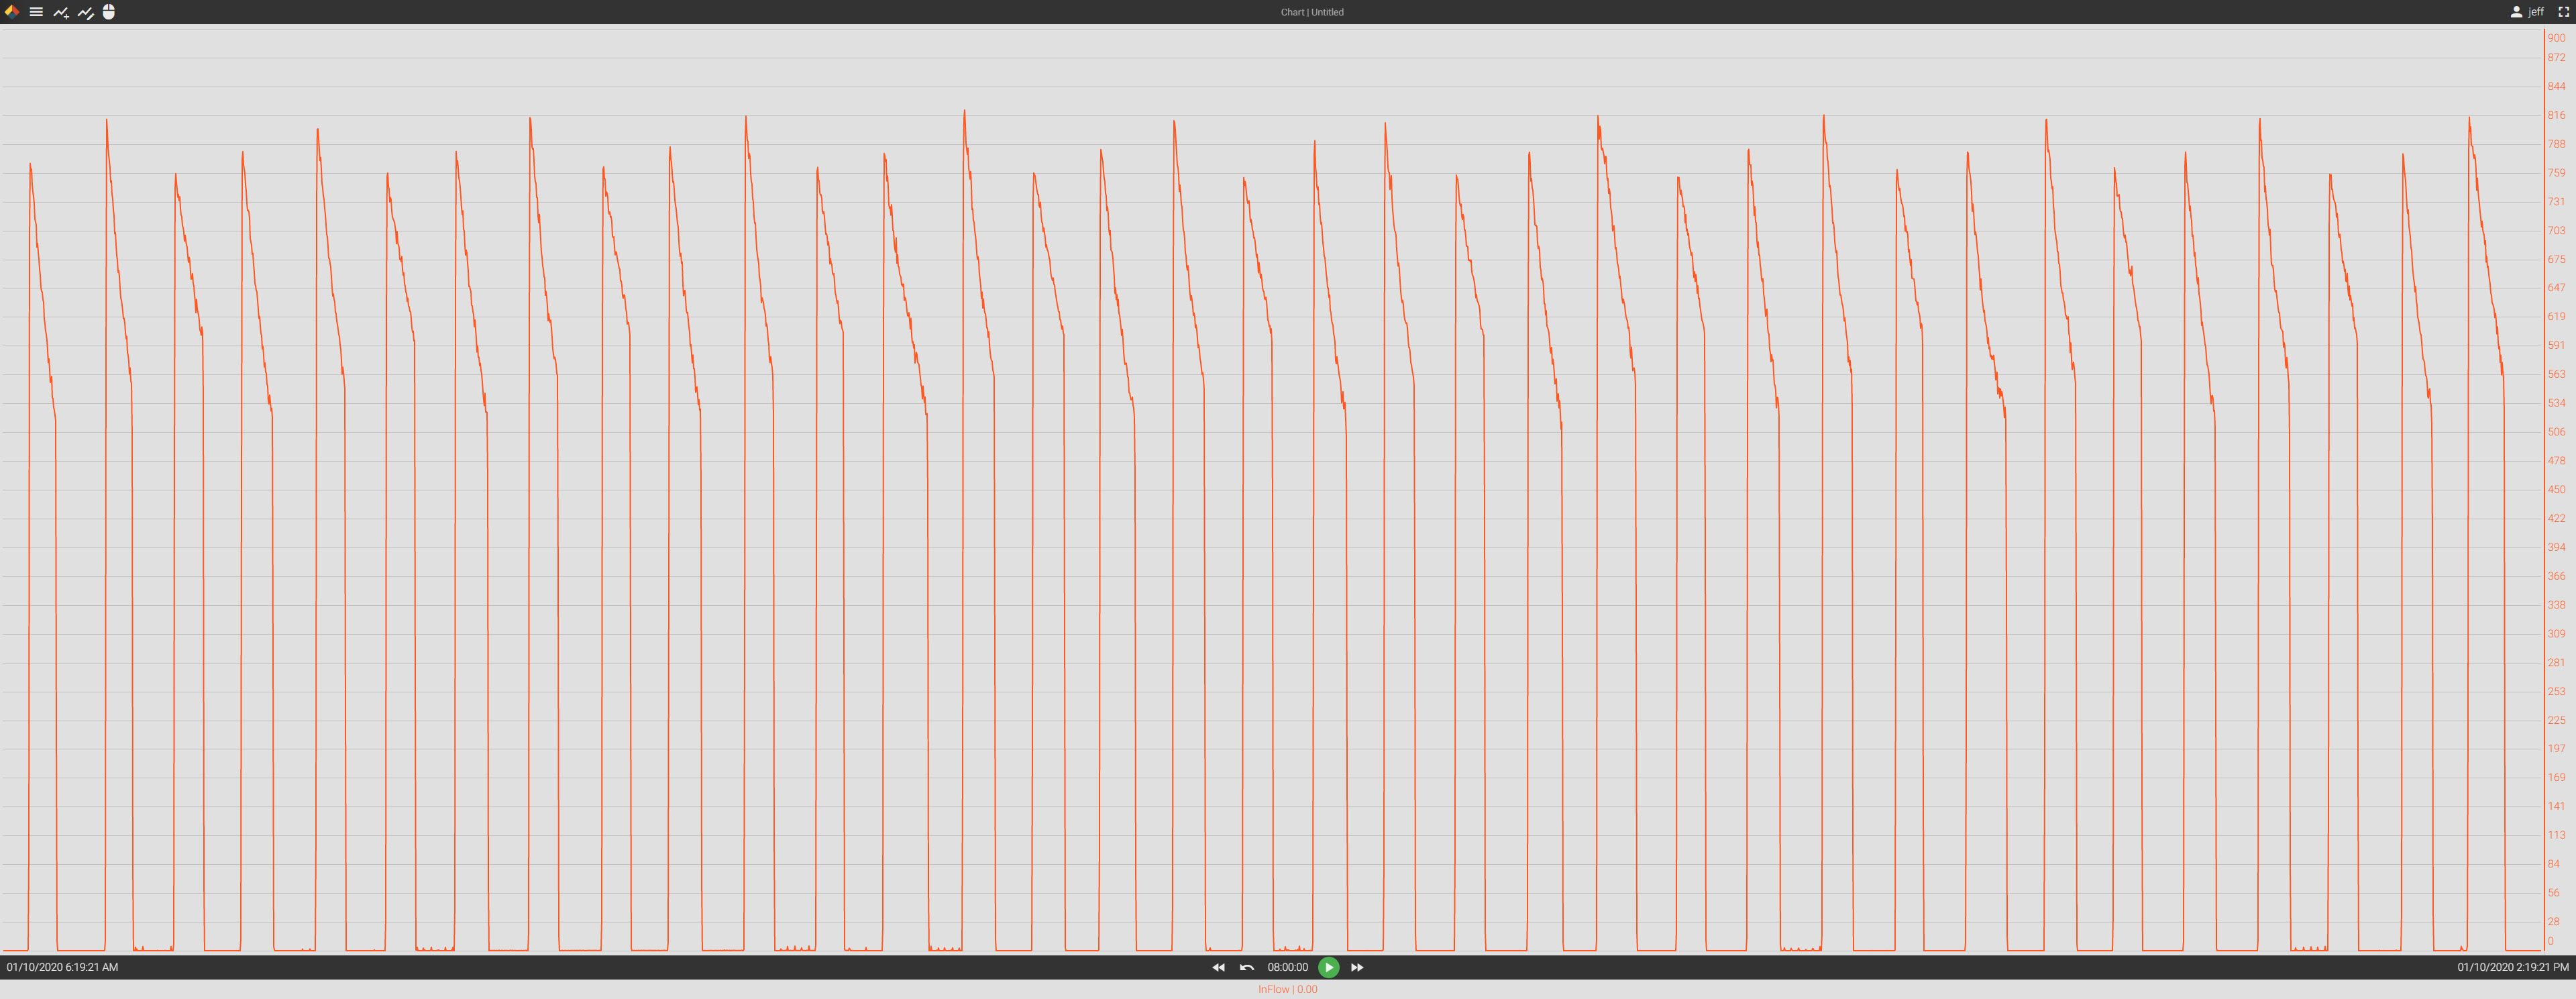
For example, a lift station's pump is being monitored with a single flow sensor. That tag is named InFlow. Typically, the pump cycles a few times per hour. Using the Axiom chart below, you can see the pump's cycle history for the past 8 hours.
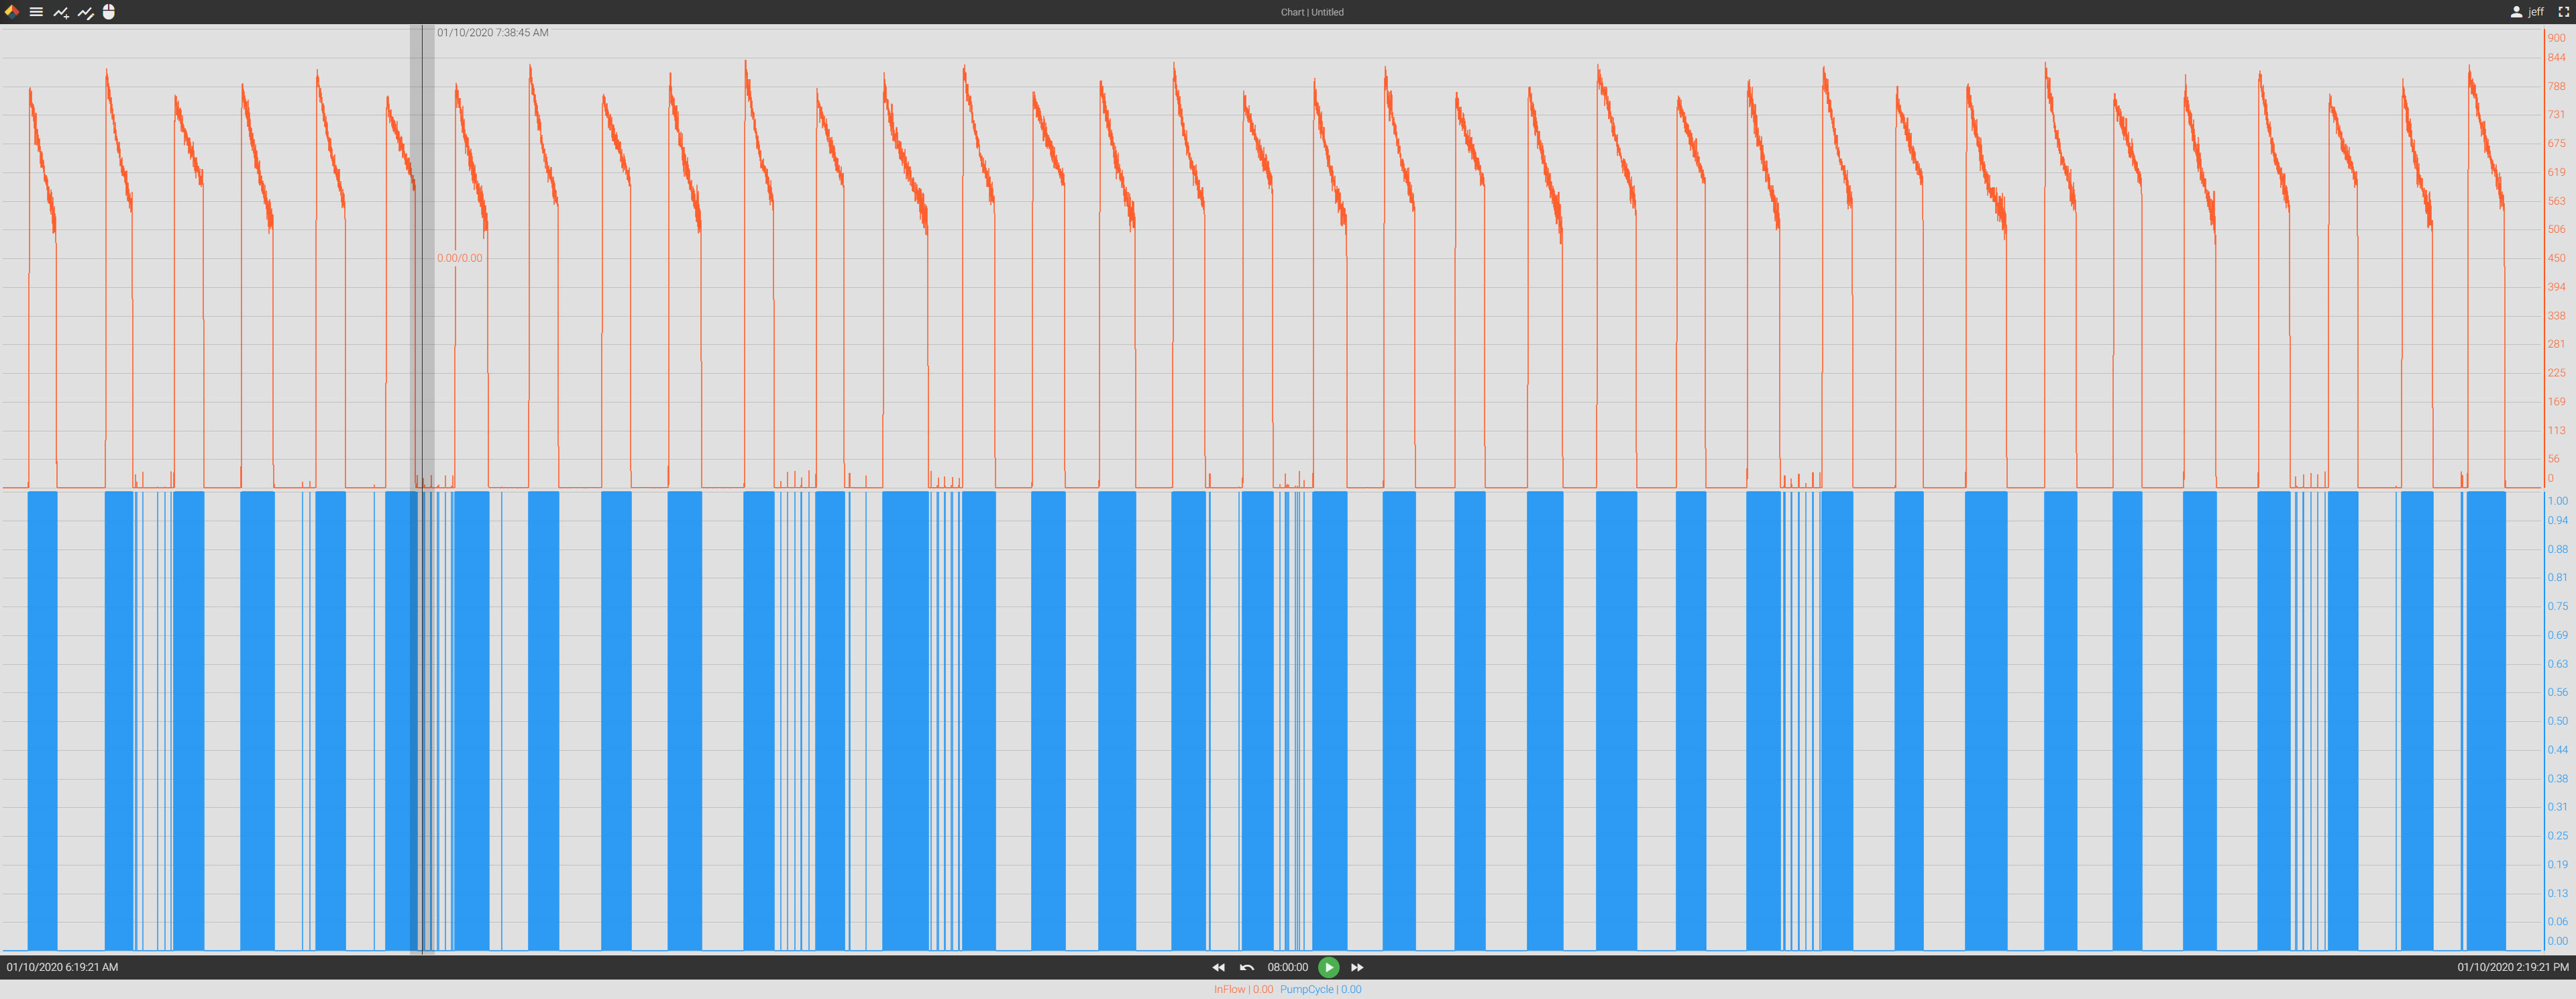
Using the Calculation Server, you can create a boolean tag to write a value of 'true' anytime the pump's flow is greater than a value of '1.0'. When we add this new calculated tag to the trend chart, we see that the pump has actually been running more frequently than we realized.
Now, by applying a second calculation, we can count the number of transitions our newly created boolean makes in a twenty-four hour period. Since the Calculation Server allows for new calculations to be back-filled historically, we can instantly obtain results.
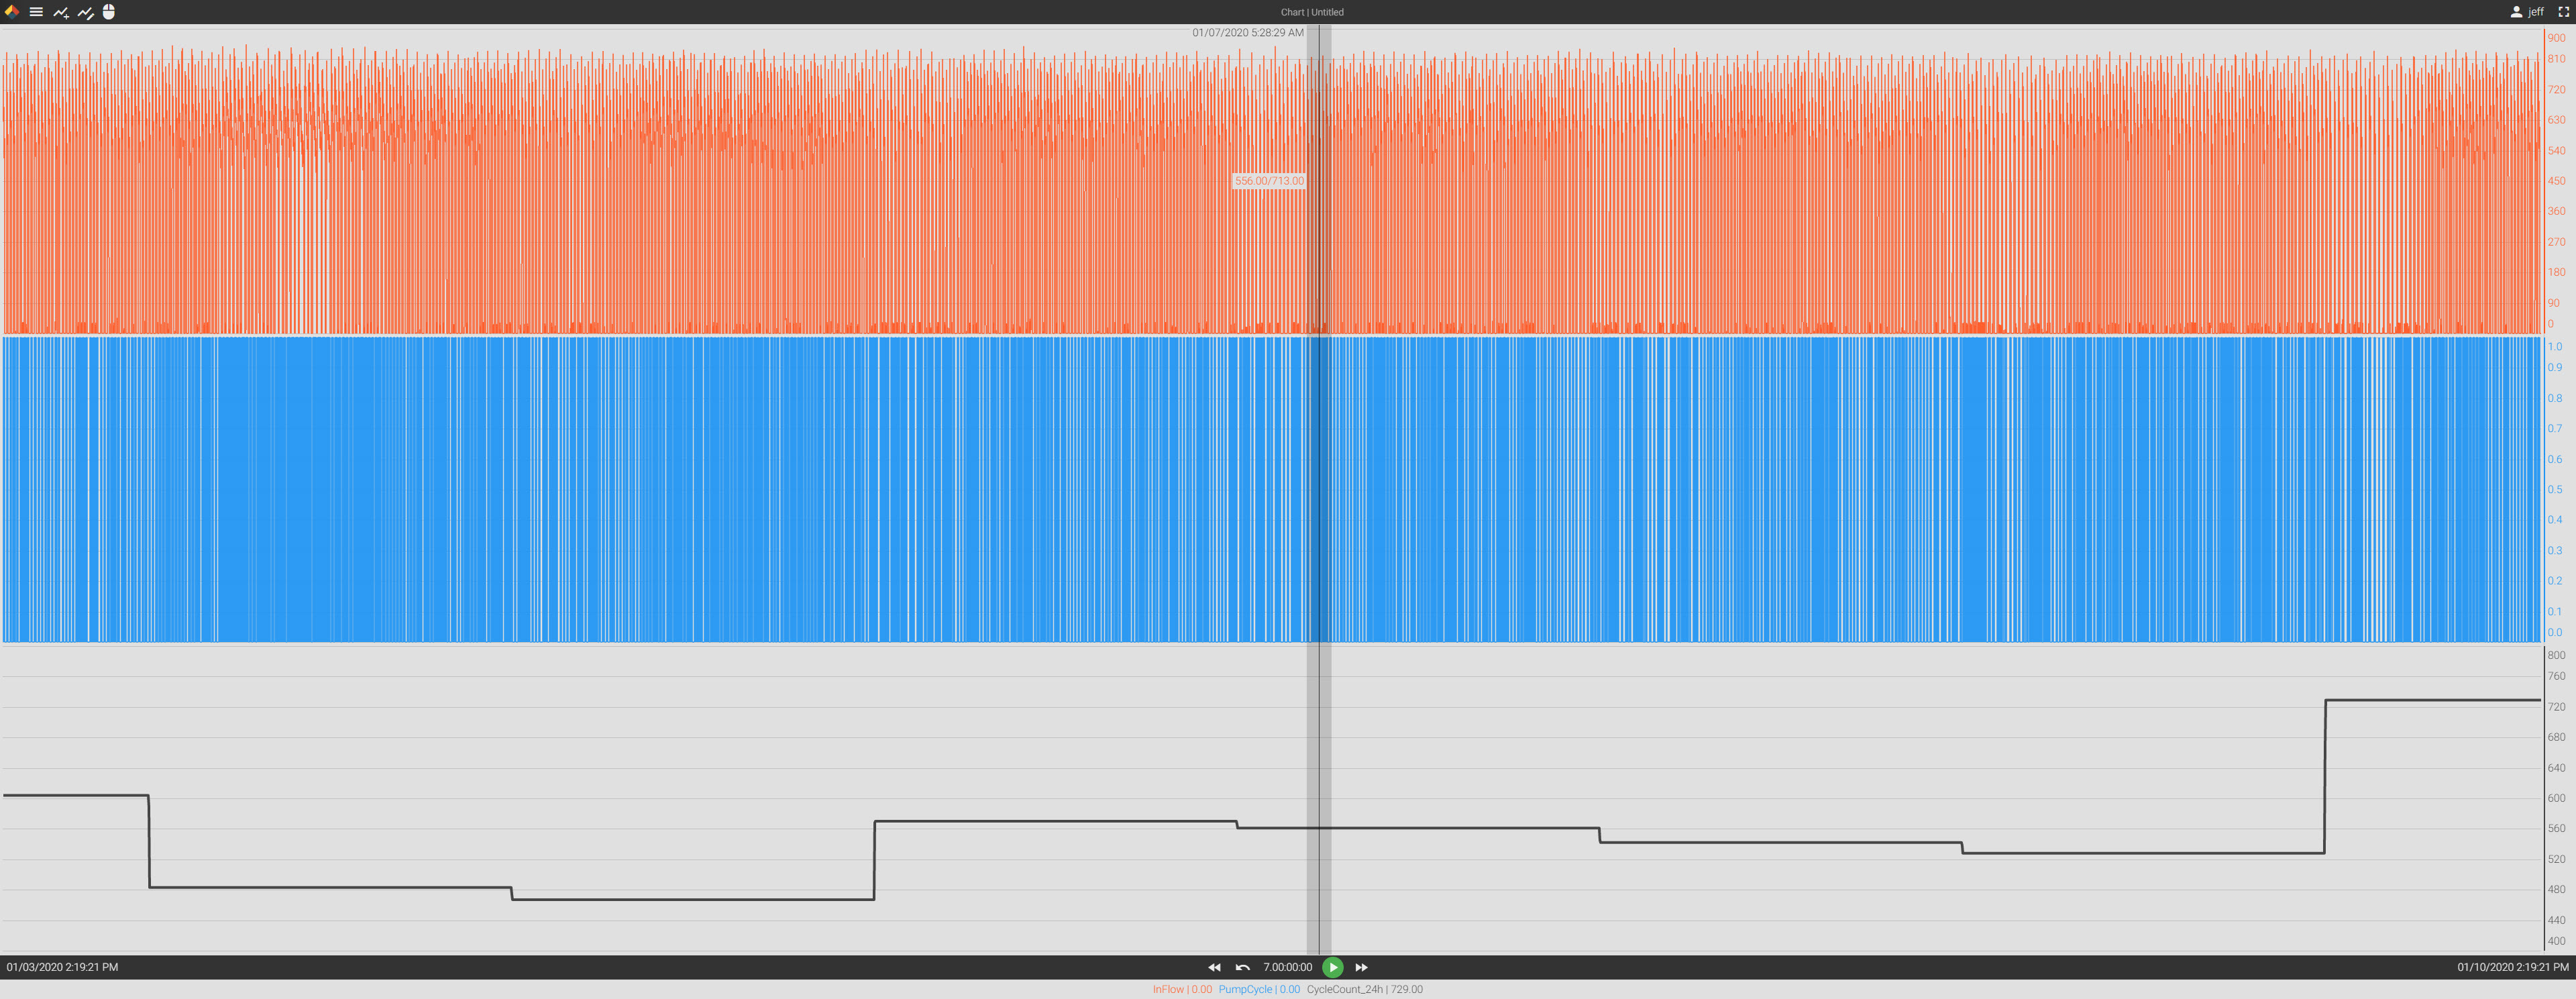
By studying the calculated tag, we can now determine the pump is cycling more often than we intended and take action.
Using the Calculation Server, you could use the same InFlow tag to provide:
- Number of pump cycles by hour, day, or month.
- Total hours the pump runs per day.
- Average flow per cycle.
- Minimum, maximum, and average flow by hour, day, or month.
- Running flow average by minute, hour, or day.
- And much more...